

Whether you’re planning to sell or refinance, ensure you’re paying the correct amount in property taxes and insurance, or just wanting to keep tabs on market trends, it’s important to understand your home’s value.
Many American cities have seen that value decrease over the last year or two — some substantially.
Find Out: How Much House Does $300K, $400K and $500K Buy You in Every State?
Learn More: How Far $750K Plus Social Security Goes in Retirement in Every US Region
To determine the current “worst” U.S. housing markets, GOBankingRates analyzed Zillow’s May 2025 data. Cities in the 250 largest Metro Statistical Areas (MSAs) were ranked based on a blend of year-over-year and two-year changes in home value (percentage and dollar value), mean days from listing to pending, mean list-to-sale ratio, mean days from pending to close, share of listings with a price cut, and mean price cut. We’ve included the full methodology at the end of this story.
Here are some key findings, based on this analysis:
-
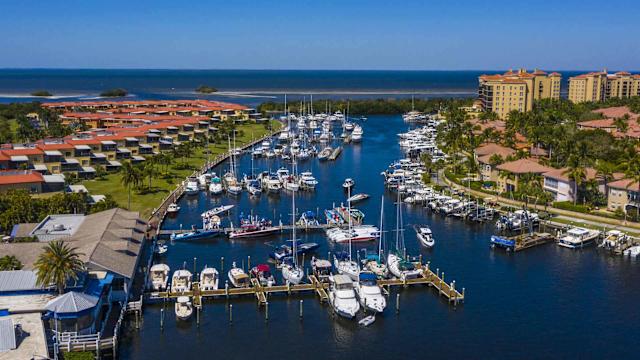
The city of Punta Gorda — located in southwest Florida about 110 miles from Tampa — has the country’s worst housing market.
-
Punta Gorda saw the largest year-over-year decrease in home value based on percentage (-10.05%). It was followed by Cape Coral, Florida (-8.19%), and Northport, Florida (-7.49%).
-
Punta Gorda also showed the largest two-year value loss by far, with homes shedding more than 12% of their value between May 2023 and May 2025.
-
Several larger cities — Austin, Tampa and New Orleans — are among the top 10 worst markets.
-
Many of the cities in the list actually showed strong overall growth between May 2023 and May 2025, before hitting a slowdown in the past year.
Here’s the full 50-city list.
Also see housing markets that will skyrocket by the end of the year.
 LM Photos / Shutterstock.com
 50. Tyler, Texas
-
May 2025 average home value: $275,275
-
1-year change in home value: 0.50%
-
2-year change in home value: 2.97%
Check Out: The Living Wage a Family of Four Needs in All 50 States
Also See: How Much You Need To Earn To Be Upper Middle Class in Every State
Michael Warren / Getty Images 49. Birmingham, Alabama
-
May 2025 average home value: $259,162
-
1-year change in home value: -0.25%
-
2-year change in home value: 0.37%
See More: 25 Places To Buy a Home If You Want It To Gain Value
Sean Pavone / Getty Images/iStockphoto 48. Charleston, West Virginia
-
May 2025 average home value: $146,416
-
1-year change in home value: 3.34%
-
2-year change in home value: 8.95%
Ken Wolter / Shutterstock.com 47. Santa Cruz, California
-
May 2025 average home value: $1,204,009
-
1-year change in home value: -2.04%
-
2-year change in home value: 2.74%
MARELBU / Wikimedia Commons CC-BY-SA 3 46. Chico, California
-
May 2025 average home value: $403,905
-
1-year change in home value: -0.17%
-
2-year change in home value: -0.82%
Sean Pavone / Shutterstock.com 45. Mobile, Alabama
-
May 2025 average home value: $196,168
-
1-year change in home value: 0.19%
-
2-year change in home value: 4.61%
Michael Warren / Getty Images 44. Tallahassee, Florida
-
May 2025 average home value: $292,884
-
1-year change in home value: -1.09%
-
2-year change in home value: 3.85%
Discover More: 4 Housing Markets That Have Plummeted in Value Over the Past 5 Years
DenisTangneyJr / iStock.com 43. Memphis, Tennessee
-
May 2025 average home value: $245,756
-
1-year change in home value: -0.61%
-
2-year change in home value: 1.18%
DenisTangneyJr / Getty Images/iStockphoto 42. Monroe, Louisiana
-
May 2025 average home value: $161,148
-
1-year change in home value: 0.11%
-
2-year change in home value: 0.90%
DenisTangneyJr / Getty Images/iStockphoto 41. Abilene, Texas
-
May 2025 average home value: $200,285
-
1-year change in home value: -0.65%
-
2-year change in home value: 1.90%
DenisTangneyJr / Getty Images/iStockphoto 40. Brownsville, Texas
-
May 2025 average home value: $195,609
-
1-year change in home value: -0.10%
-
2-year change in home value: 3.15%
Muhammad Zulkifal / Getty Images/iStockphoto 39. Denver
-
May 2025 average home value: $617,695
-
1-year change in home value: -1.64%
-
2-year change in home value: 0.76%
Explore More: The Cheapest Place To Buy a Home in Every State
Thomas R Machnitzki / Wikimedia Commons 38. Jackson, Tennessee
-
May 2025 average home value: $206,888
-
1-year change in home value: 0.58%
-
2-year change in home value: 3.87%
Bryan Pollard / Getty Images 37. Gainesville, Florida
-
May 2025 average home value: $320,636
-
1-year change in home value: -1.17%
-
2-year change in home value: 3.33%
Sean Pavone / Shutterstock.com 36. Macon, Georgia
-
May 2025 average home value: $194,903
-
1-year change in home value: -0.02%
-
2-year change in home value: 5.12%
DenisTangneyJr / Getty Images/iStockphoto 35. Lake Havasu City, Arizona
-
May 2025 average home value: $357,885
-
1-year change in home value: -0.89%
-
2-year change in home value: 0.96%
DenisTangneyJr / Getty Images/iStockphoto 34. Tucson, Arizona
-
May 2025 average home value: $361,756
-
1-year change in home value: -1.75%
-
2-year change in home value: 2.40%
See More: 5 Cities Where Homes Will Be a Total Steal in 2 Years
Nate Hovee / Getty Images/iStockphoto 33. Atlanta
-
May 2025 average home value: $395,784
-
1-year change in home value: -2.03%
-
2-year change in home value: 2.34%
Giorgia Basso / Shutterstock.com 32. Killeen, Texas
-
May 2025 average home value: $254,036
-
1-year change in home value: -2.32%
-
2-year change in home value: -3.18%
DenisTangneyJr / Getty Images 31. Lubbock, Texas
-
May 2025 average home value: $208,038
-
1-year change in home value: -2.84%
-
2-year change in home value: -2.42%
wbritten / Getty Images/iStockphoto 30. Myrtle Beach, South Carolina
-
May 2025 average home value: $365,957
-
1-year change in home value: -1.40%
-
2-year change in home value: 0.78%
TrongNguyen / Getty Images/iStockphoto 29. Waco, Texas
-
May 2025 average home value: $256,616
-
1-year change in home value: -1.48%
-
2-year change in home value: -0.20%
Find Out: 20 Best Cities Where You Can Buy a House for Under $100K
Jacob Boomsma / Shutterstock.com 28. Beaumont, Texas
-
May 2025 average home value: $175,211
-
1-year change in home value: 0.48%
-
2-year change in home value: -1.11%
ejs9 / Getty Images/iStockphoto 27. Hilo, Hawaii
-
May 2025 average home value: $565,729
-
1-year change in home value: -0.96%
-
2-year change in home value: 0.54%
©Zillow 26. Orlando, Florida
-
May 2025 average home value: $409,504
-
1-year change in home value: -2.50%
-
2-year change in home value: 1.11%
f11photo / Shutterstock.com 25. Houston
-
May 2025 average home value: $318,323
-
1-year change in home value: -1.28%
-
2-year change in home value: 0.44%
©Shutterstock.com 24. Panama City, Florida
-
May 2025 average home value: $328,932
-
1-year change in home value: -2.40%
-
2-year change in home value: -1.09%
Read More: Here’s the Line Between Middle Class and Upper-Middle Class in Every State
Art Wager / iStock/Getty Images 23. Pensacola, Florida
-
May 2025 average home value: $300,927
-
1-year change in home value: -2.26%
-
2-year change in home value: -0.33%
Rocky89 / iStock.com 22. Miami
-
May 2025 average home value: $571,719
-
1-year change in home value: -1.10%
-
2-year change in home value: 7.09%
DenisTangneyJr / Getty Images/iStockphoto 21. Lafayette, Louisiana
-
May 2025 average home value: $198,154
-
1-year change in home value: -2.81%
-
2-year change in home value: -4.38%
Art Wager / iStock.com 20. Phoenix
-
May 2025 average home value: $466,712
-
1-year change in home value: -2.77%
-
2-year change in home value: 1.62%
TraceRouda / Getty Images/iStockphoto 19. Jacksonville, Florida
-
May 2025 average home value: $365,803
-
1-year change in home value: -2.33%
-
2-year change in home value: -0.79%
Check Out: How Much Money Is Needed To Be Considered Middle Class in Every State?
Jimmy Emerson / Flickr.com 18. Crestview, Florida
-
May 2025 average home value: $411,945
-
1-year change in home value: -2.98%
-
2-year change in home value: -2.33%
Sean Pavone / Shutterstock.com 17. Dallas
-
May 2025 average home value: $380,068
-
1-year change in home value: -2.82%
-
2-year change in home value: -1.37%
Sean Pavone / Getty Images/iStockphoto 16. Corpus Christi, Texas
-
May 2025 average home value: $219,045
-
1-year change in home value: -2.33%
-
2-year change in home value: -1.59%
Sean Pavone / Getty Images/iStockphoto 15. Lakeland, Florida
-
May 2025 average home value: $308,714
-
1-year change in home value: -3.59%
-
2-year change in home value: -1.87%
MichaelWarrenPix / Getty Images/iStockphoto 14. Ocala, Florida
-
May 2025 average home value: $281,989
-
1-year change in home value: -2.34%
-
2-year change in home value: -1.80%
See More: Here’s the Cost of Living in Every State
Sean Pavone / Getty Images/iStockphoto 13. San Antonio, Texas
-
May 2025 average home value: $287,611
-
1-year change in home value: -3.07%
-
2-year change in home value: -5.00%
©Shutterstock.com 12. Palm Bay, Florida
-
May 2025 average home value: $359,107
-
1-year change in home value: -3.58%
-
2-year change in home value: -1.32%
©Shutterstock.com 11. Lake Charles, Louisiana
-
May 2025 average home value: $196,047
-
1-year change in home value: -1.93%
-
2-year change in home value: -6.91%
travelview / Shutterstock.com 10. Houma, Louisiana
-
May 2025 average home value: $187,393
-
1-year change in home value: -5.01%
-
2-year change in home value: -2.18%
FloridaStock / Shutterstock.com 9. Port St. Lucie, Florida
-
May 2025 average home value: $405,319
-
1-year change in home value: -3.52%
-
2-year change in home value: -0.56%
Also Find: The Cheapest Place To Buy a Home in Every State
Paulo Almeida / Getty Images 8. Deltona, Florida
-
May 2025 average home value: $338,186
-
1-year change in home value: -3.80%
-
2-year change in home value: -2.20%
Larry Gibson / iStock.com 7. New Orleans
-
May 2025 average home value: $254,505
-
1-year change in home value: -2.23%
-
2-year change in home value: -9.01%
Michael Warren / Getty Images 6. Tampa, Florida
-
May 2025 average home value: $383,706
-
1-year change in home value: -4.46%
-
2-year change in home value: -1.03%
RoschetzkyIstockPhoto / Getty Images 5. Austin, Texas
-
May 2025 average home value: $458,253
-
1-year change in home value: -4.99%
-
2-year change in home value: -8.72%
Learn More: Here’s How Much You Need To Earn To Be ‘Rich’ in Every State
ablokhin / Getty Images 4. Naples, Florida
-
May 2025 average home value: $700,334
-
1-year change in home value: -6.62%
-
2-year change in home value: -2.58%
Khairil Azhar Junos / Shutterstock.com 3. Cape Coral, Florida
-
May 2025 average home value: $374,134
-
1-year change in home value: -8.19%
-
2-year change in home value: -8.82%
PCHS-NJROTC / Wikimedia Commons 2. North Port, Florida
-
May 2025 average home value: $439,876
-
1-year change in home value: -7.49%
-
2-year change in home value: -7.90%
Vito Palmisano / Getty Images/iStockphoto 1. Punta Gorda, Florida
-
May 2025 average home value: $331,375
-
1-year change in home value: -10.05%
-
2-year change in home value: -12.29%
Methodology: For this piece, GOBankingRates looked at the Real Estate market’s 250 largest Metro Statistical Areas (MSAs) and sourced the following ten factors: (1) 1-year percent change in home value; (2) 1-year change in home value in USD; (3) 2-year percent change in home value; (4) 2-year change in home value in USD; (5) for-sale inventory; (6) mean days from listing to pending; (7) mean list-to-sale ratio; (8) mean days from pending to close; (9) share of listings with a price cut; and (10) mean price cut. All data was sourced from Zillow’s May 2025 data. All 10 factors were scored and combined, with the highest scores determining the worst housing markets. Numbers for (1), (2), (9), and (10) were weighted 2x, and factor (5) was weighted 0.5x. All data was collected on and is up to date as of June 16, 2025.
This article originally appeared on GOBankingRates.com: 50 Worst Housing Markets in the US for Growth


The report, '50 Worst Housing Markets in the US for Growth,' unmistakably delineates challenged regions with insufficient current and projected progress towards residential economy development.

Navigating the 50 Worst Housing Markets in US for Growth can be a daunting task, as buyers must consider compatibility of their financial expectations with areas that lag behind on growth prospects and value appreciations.

The report '50 Worst Housing Markets in the US for Growth' is a sobering reminder of remote regions and underdeveloped towns where investments risk stagnation due to economic disparities, limited job opportunities beyond tappa抱歉的晋江 GDP booms.